ScryLab as a matplotlib and Plotly alternative for exploratory signal analysis

You know the drill: run a cell, get a static matplotlib plot, tweak a parameter, run it again. Or you reach for Plotly to get something interactive – but now you are writing layout configuration instead of doing analysis.
ScryLab takes a different approach: it runs as a standalone desktop application alongside your notebook, and you send signals to it via a small Python wrapper. The plot stays open while you keep working – persistent, interactive, and out of your way.
Two lines to get started
Install the wrapper from PyPI:
pip install scrylabThen, from your notebook:
import numpy as np
import scrylab as scry

t = np.linspace(0, 5, 10_000)
y = np.sin(2 * np.pi * 10 * t) * np.exp(-0.3 * t)
y_noisy = np.sin(2 * np.pi * 7 * t) * np.exp(-0.5 * t) + np.random.normal(0, 0.05, size=t.shape)

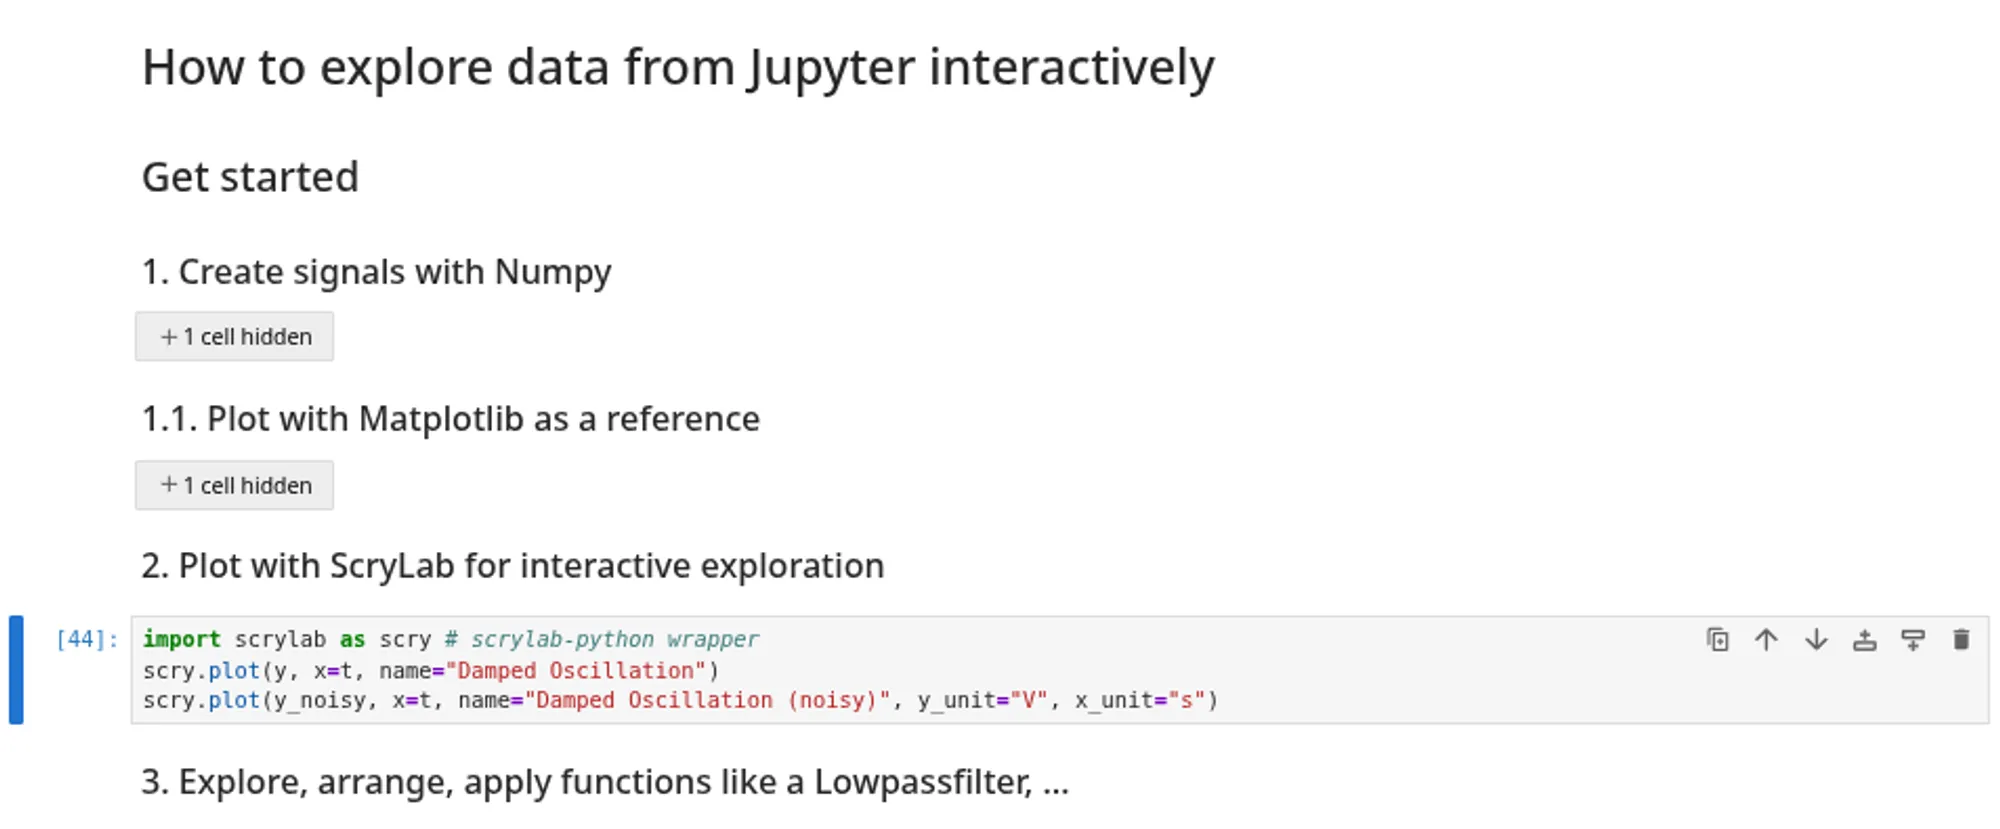
scry.plot(y, x=t, name="Damped Oscillation")
scry.plot(y_noisy, x=t, name="Damped Oscillation (noisy)", y_unit="V", x_unit="s")
scry.plot() sends the signal to ScryLab and places it in the active plot – no axis configuration, no figure boilerplate, no output cell to scroll past. Units and signal names appear directly in the ScryLab interface.
What you get in ScryLab
Once the signals are there, you work with them interactively in ScryLab – entirely without writing more code:
- Zoom and pan with the mouse across all stacked plots simultaneously
- Apply operations like FFT, STFT, moving average, derivative, or integral directly from the UI
- Arrange signals across multiple plot rows for side-by-side comparison
- Switch to XY, frequency, or spectrogram view depending on what you are looking for
This is where ScryLab differs from notebook-based tools like Plotly or Bokeh: the analysis UI is not embedded in the notebook output. It lives in a dedicated window that persists across cell executions.
Updating data without losing your layout
The other common friction point: you change something in your model and want to see the effect on a signal you are already looking at. With matplotlib you re-run the cell and get a new static image. With ScryLab you send the updated array with overwrite=True:
y_noisy = np.sin(2 * np.pi * 10 * t) * np.exp(-0.3 * t) + np.random.normal(0, 0.05, size=t.shape)

scry.send(y_noisy, name="Damped Oscillation (noisy)", x=t, y_unit="V", x_unit="s", overwrite=True)
The signal updates in place. Your zoom level, layout, and any applied operations stay as they are.
Not a replacement for matplotlib
matplotlib is the right tool for generating figures for reports or papers – reproducible, scriptable, publication-ready. ScryLab is for the exploratory phase that comes before: when you are still figuring out what the data looks like, what frequency content it has, whether the filter is doing what you expect.
The two workflows complement each other. You explore in ScryLab, then formalize the relevant output in matplotlib.
TIP
For sending multiple signals at once, use scry.send_many() instead of calling scry.send() in a loop. See the scrylab-python documentation for the full API reference.