Reveal the Unseen.
Desktop app for visualizing and analyzing measurement and simulation data for engineers.
Linux · Windows
Showcase
Visualization
Extensive plot types
Workflow integration
Measurement and simulation data
Load MDF measurement files directly – or connect ScryLab to Python/MATLAB to use it as a plotting tool.
Variable possibilities
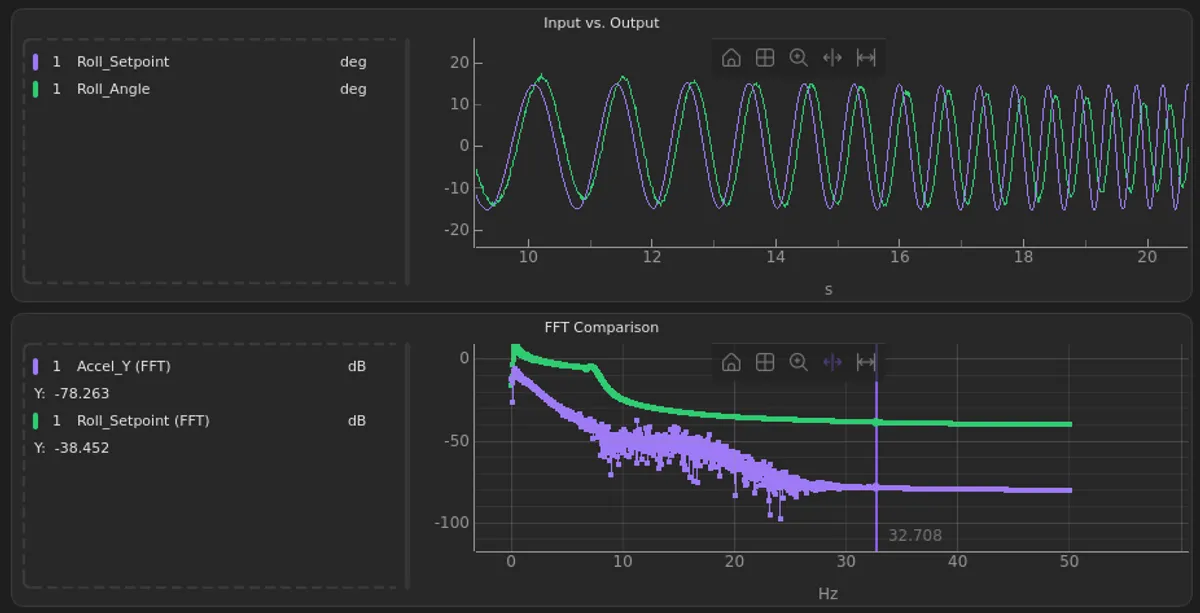
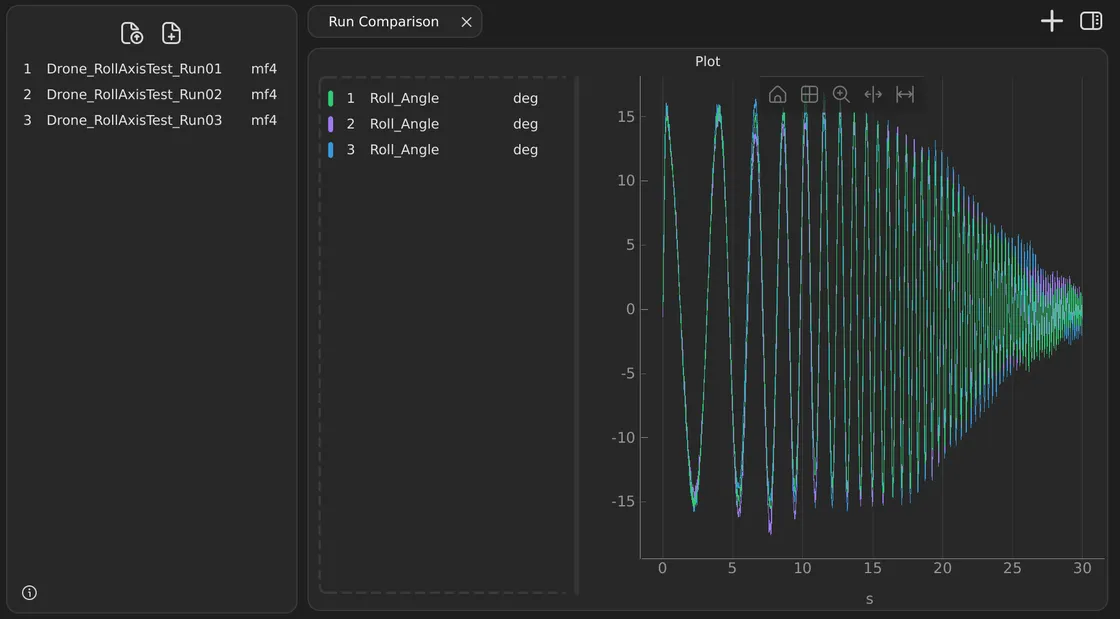
Compare different datasets
Plot signals from multiple measurement runs or simulations side by side in the same plot. Differences stand out immediately – whether comparing run to run or measurement against simulation.
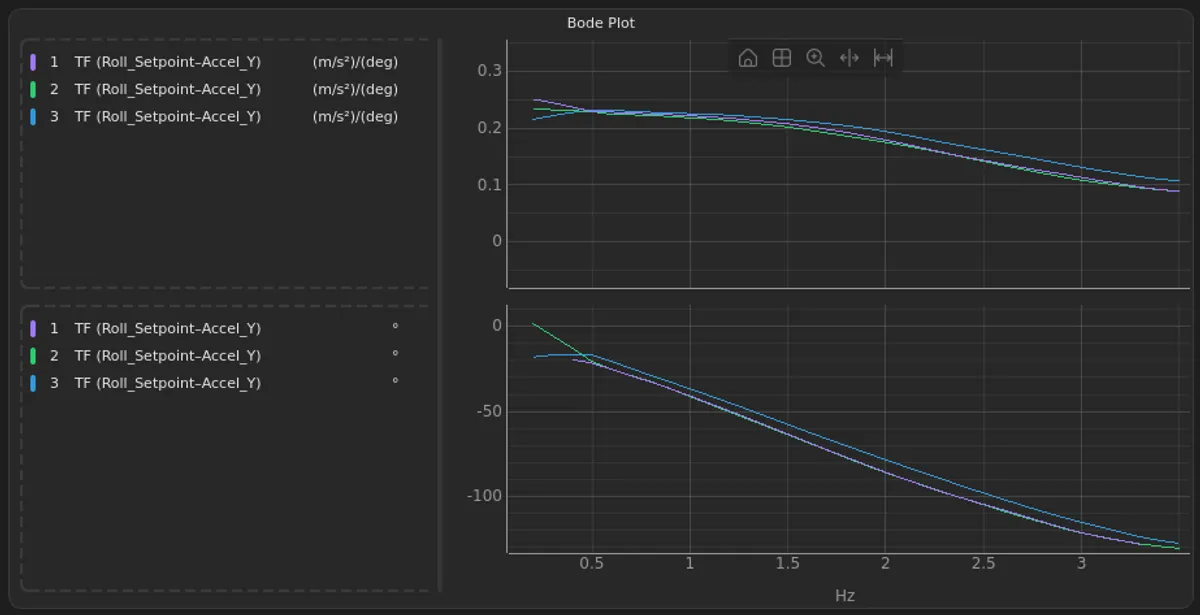
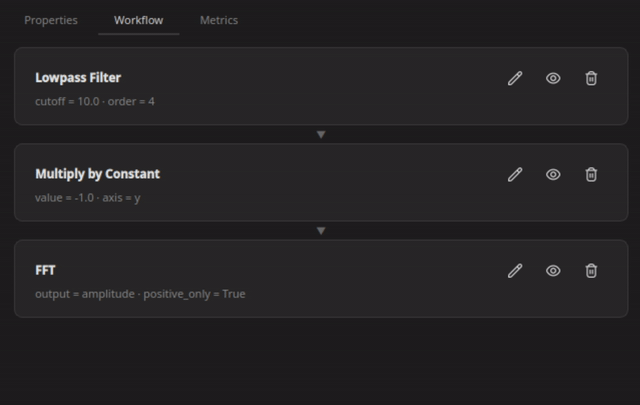
Mathematical operations
Manipulate signals
Operations like addition, spline fitting, RMS, or transfer function can be applied as a processing step. Every step can be adjusted, disabled, or removed at any time.
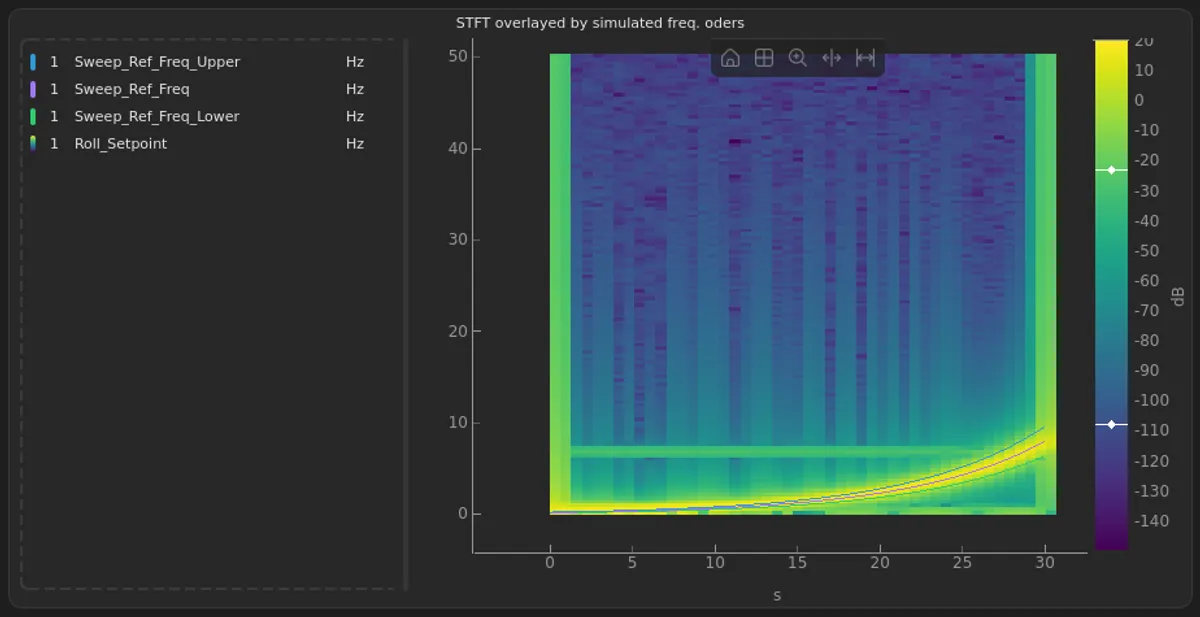
Smooth scrolling
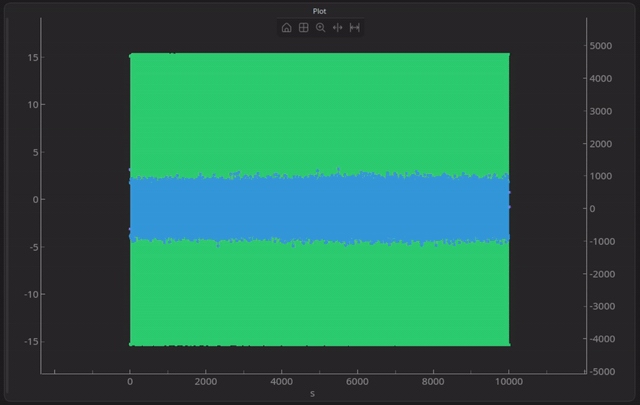
Explore large datasets
Zoom, scroll, and navigate fluently – even with datasets of over 10 million samples, ScryLab runs at more than 60 FPS.
FAQ
Our plans
Plan overview
Non-commercial
For personal use and education
Free
- All features
- Free updates
- Commercial use
- Support
- No watermark
Commercial
For professional use
Custom
- All features
- Free updates
- Commercial use
- Support
- No watermark